

Contents
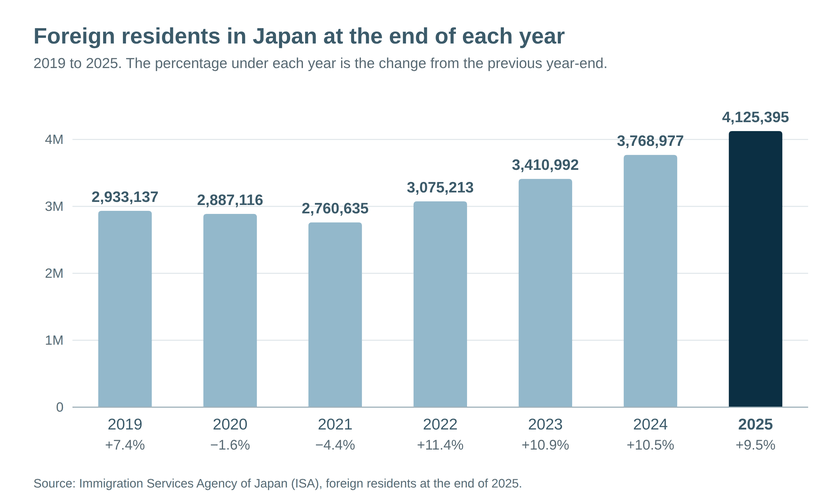
Japan’s Immigration Services Agency (ISA) has published the number of foreign residents in Japan at the end of 2025: 4,125,395. It is the first time the figure has passed 4 million, and the fourth year in a row that it has set a record. It is 356,418 more than a year earlier (+9.5%) and about twice the level at the end of 2012. Here is what the figures show, what patterns we notice, and what they cannot tell us.
What do these figures count?
The ISA’s total is the sum of two groups. Mid- to long-term residents (3,858,499) are people who hold a status of residence, such as for work, study or family reasons, and a residence card. Special permanent residents (266,896) hold a special permanent resident certificate, and about 99% of them are recorded as South Korean, “Chosen” or Taiwanese. “Chosen” is the ISA’s notation for people of Korean Peninsula origin whose nationality has not been confirmed. Short-term visitors are not counted. Nationality is as written on the residence card or certificate.
The ISA also reports 2,110,599 men (51.2%), 2,014,735 women (48.8%) and 61 people in the “other” gender category.
What we noticed
The ISA reports the numbers and does not explain them. What follows are our own observations:
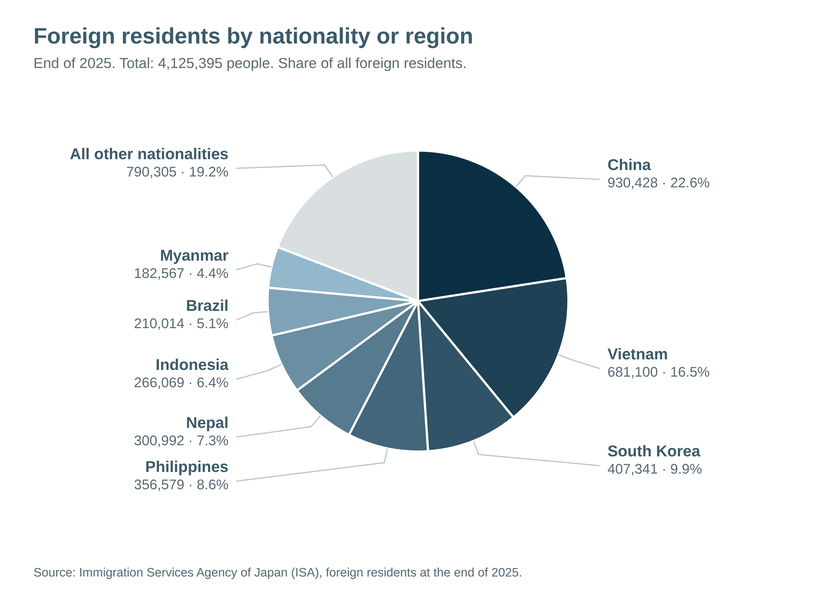
- Growth is easing slightly, and a few nationalities account for most of it. The annual growth rate has eased from 11.4% in 2022 to 9.5% in 2025, although the number of people added has stayed at roughly 356,000 to 358,000 in each of the last two years. Five nationalities account for about 80% of the 2025 increase: Nepal (+67,949), Indonesia (+66,245), China (+57,142), Myanmar (+47,993) and Vietnam (+46,739). Nepal, Indonesia and Myanmar each grew by roughly 29% to 36% in a single year. South Korea (−0.5%), Brazil (−0.9%) and Peru (−0.5%) declined slightly.
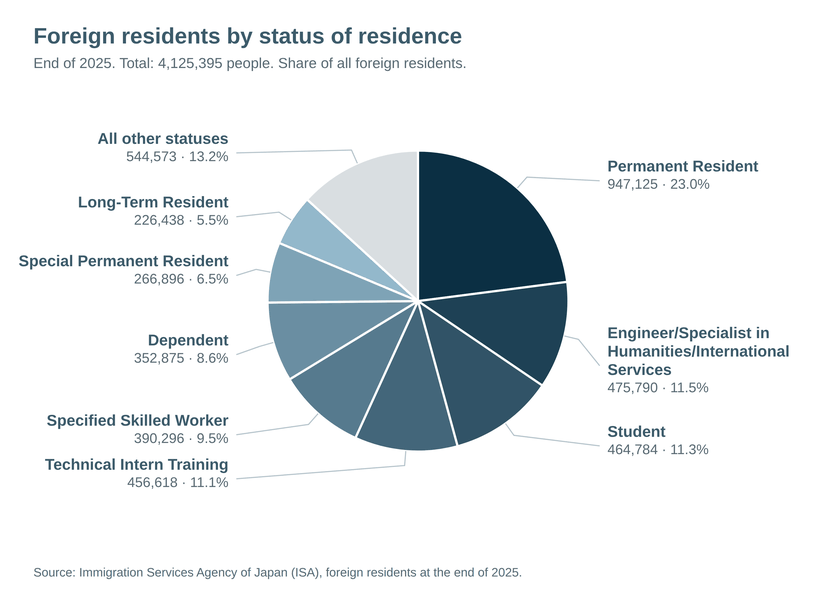
- Work and study statuses are driving the growth, led by Specified Skilled Worker. This status added 105,830 people (+37.2%), the largest increase of any status, and now stands at 390,296, compared with 15,663 at the end of 2020. Its second category, Specified Skilled Worker (ii), went from 832 to 7,955. Technical Intern Training, by contrast, was flat at 456,618 (+23). Student (+62,650), Engineer/Specialist in Humanities/International Services (+57,084) and Dependent (+47,277) also grew by 13.6% to 15.6%.
- Settled statuses grow slowly, and special permanent residents are declining. Permanent Resident is still the largest single status at 947,125 (23.0% of the total), but it grew only 3.2%. Long-Term Resident grew 1.4% and Spouse or Child of Japanese National 1.3%. The number of Special Permanent Residents fell 2.6% to 266,896, and it has declined every year since 2020, when it was 304,430.
- Nationality and status of residence are closely linked. Vietnamese residents with Technical Intern Training or Specified Skilled Worker status make up 52% of all Vietnamese residents, and Indonesians with those two statuses 80%. For Nepal, Student and Dependent together account for 63%. For Brazil, Permanent Resident and Long-Term Resident account for 89%, and for South Korea, Special Permanent Residents alone are 59%. A single national total can hide very different situations.
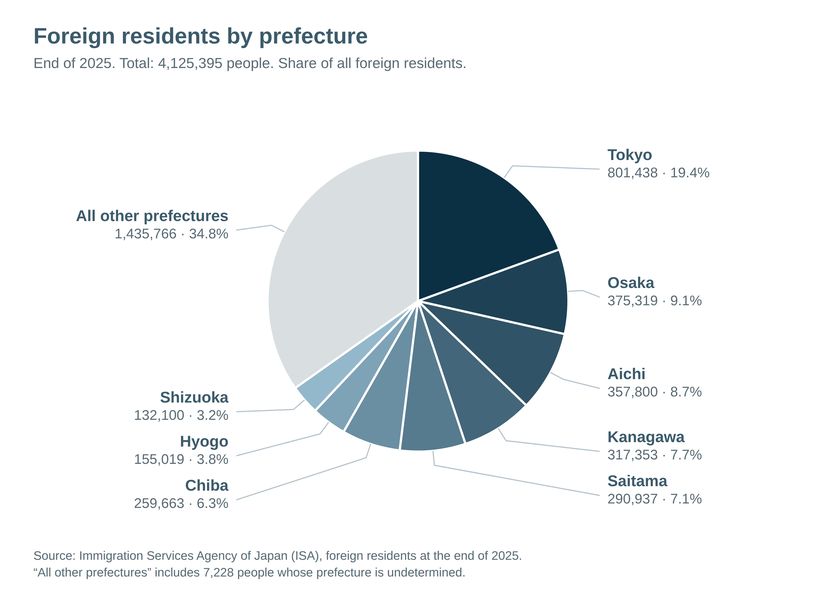
- Growth is nationwide, but residents are concentrated in a few prefectures. Every one of the 47 prefectures grew. Tokyo has 801,438 foreign residents (19.4%), and Tokyo, Osaka, Aichi and Kanagawa together account for 44.9%. The fastest growth rates were mostly elsewhere: Hokkaido (+14.7%), Okinawa and Wakayama (+13.7% each) and Oita (+13.3%). Among the large prefectures, Osaka (+12.5%) and Chiba (+12.1%) grew faster than Tokyo (+8.5%).
The figures at a glance
The tables below are our own English summary of the ISA’s Japanese-language tables, which cover 20 nationalities and all 47 prefectures. “Change” compares the end of 2025 with the end of 2024, and “share” is the share of all foreign residents. The “all other” rows and their changes are our own calculations from the ISA’s totals. Shares may not add up to exactly 100% because of rounding.
1. Total foreign residents at the end of each year
| End of year | Foreign residents | Change (people) | Change (%) |
|---|---|---|---|
| 2019 | 2,933,137 | +202,044 | +7.4% |
| 2020 | 2,887,116 | -46,021 | -1.6% |
| 2021 | 2,760,635 | -126,481 | -4.4% |
| 2022 | 3,075,213 | +314,578 | +11.4% |
| 2023 | 3,410,992 | +335,779 | +10.9% |
| 2024 | 3,768,977 | +357,985 | +10.5% |
| 2025 | 4,125,395 | +356,418 | +9.5% |
2. By nationality or region (ten largest groups)
| Nationality / region | End of 2024 | End of 2025 | Change | Change (%) | Share |
|---|---|---|---|---|---|
| Total | 3,768,977 | 4,125,395 | +356,418 | +9.5% | 100.0% |
| China | 873,286 | 930,428 | +57,142 | +6.5% | 22.6% |
| Vietnam | 634,361 | 681,100 | +46,739 | +7.4% | 16.5% |
| South Korea | 409,238 | 407,341 | -1,897 | -0.5% | 9.9% |
| Philippines | 341,518 | 356,579 | +15,061 | +4.4% | 8.6% |
| Nepal | 233,043 | 300,992 | +67,949 | +29.2% | 7.3% |
| Indonesia | 199,824 | 266,069 | +66,245 | +33.2% | 6.4% |
| Brazil | 211,907 | 210,014 | -1,893 | -0.9% | 5.1% |
| Myanmar | 134,574 | 182,567 | +47,993 | +35.7% | 4.4% |
| Sri Lanka | 63,472 | 79,128 | +15,656 | +24.7% | 1.9% |
| Taiwan | 70,147 | 73,256 | +3,109 | +4.4% | 1.8% |
| All other nationalities | 597,607 | 637,921 | +40,314 | +6.7% | 15.5% |
3. By status of residence
| Status of residence | End of 2024 | End of 2025 | Change | Change (%) | Share |
|---|---|---|---|---|---|
| Total | 3,768,977 | 4,125,395 | +356,418 | +9.5% | 100.0% |
| Permanent Resident | 918,116 | 947,125 | +29,009 | +3.2% | 23.0% |
| Engineer/Specialist in Humanities/International Services | 418,706 | 475,790 | +57,084 | +13.6% | 11.5% |
| Student | 402,134 | 464,784 | +62,650 | +15.6% | 11.3% |
| Technical Intern Training | 456,595 | 456,618 | +23 | 0.0% | 11.1% |
| Specified Skilled Worker | 284,466 | 390,296 | +105,830 | +37.2% | 9.5% |
| Dependent | 305,598 | 352,875 | +47,277 | +15.5% | 8.6% |
| Long-Term Resident | 223,411 | 226,438 | +3,027 | +1.4% | 5.5% |
| Spouse or Child of Japanese National | 150,896 | 152,898 | +2,002 | +1.3% | 3.7% |
| Designated Activities | 95,508 | 125,286 | +29,778 | +31.2% | 3.0% |
| Special Permanent Resident | 274,023 | 266,896 | -7,127 | -2.6% | 6.5% |
| All other statuses | 239,524 | 266,389 | +26,865 | +11.2% | 6.5% |
4. By prefecture (ten largest)
| Prefecture | End of 2024 | End of 2025 | Change | Change (%) | Share |
|---|---|---|---|---|---|
| Total | 3,768,977 | 4,125,395 | +356,418 | +9.5% | 100.0% |
| Tokyo | 738,946 | 801,438 | +62,492 | +8.5% | 19.4% |
| Osaka | 333,564 | 375,319 | +41,755 | +12.5% | 9.1% |
| Aichi | 331,733 | 357,800 | +26,067 | +7.9% | 8.7% |
| Kanagawa | 292,450 | 317,353 | +24,903 | +8.5% | 7.7% |
| Saitama | 262,382 | 290,937 | +28,555 | +10.9% | 7.1% |
| Chiba | 231,614 | 259,663 | +28,049 | +12.1% | 6.3% |
| Hyogo | 142,676 | 155,019 | +12,343 | +8.7% | 3.8% |
| Shizuoka | 124,281 | 132,100 | +7,819 | +6.3% | 3.2% |
| Fukuoka | 113,159 | 125,501 | +12,342 | +10.9% | 3.0% |
| Ibaraki | 102,549 | 111,808 | +9,259 | +9.0% | 2.7% |
| All other prefectures and undetermined | 1,095,623 | 1,198,457 | +102,834 | +9.4% | 29.1% |
5. The main statuses within the eight largest nationality groups
| Nationality | Total | Largest status | Second | Third |
|---|---|---|---|---|
| China | 930,428 | Permanent Resident 357,565 (38%) | Student 148,151 (16%) | Engineer/Specialist in Humanities/International Services 117,314 (13%) |
| Vietnam | 681,100 | Technical Intern Training 189,756 (28%) | Specified Skilled Worker 164,352 (24%) | Engineer/Specialist in Humanities/International Services 121,079 (18%) |
| South Korea | 407,341 | Special Permanent Resident 241,712 (59%) | Permanent Resident 77,013 (19%) | Engineer/Specialist in Humanities/International Services 28,457 (7%) |
| Philippines | 356,579 | Permanent Resident 143,784 (40%) | Long-Term Resident 63,937 (18%) | Technical Intern Training 42,289 (12%) |
| Nepal | 300,992 | Student 116,151 (39%) | Dependent 72,978 (24%) | Engineer/Specialist in Humanities/International Services 48,813 (16%) |
| Indonesia | 266,069 | Technical Intern Training 124,967 (47%) | Specified Skilled Worker 86,955 (33%) | Engineer/Specialist in Humanities/International Services 10,424 (4%) |
| Brazil | 210,014 | Permanent Resident 117,593 (56%) | Long-Term Resident 68,882 (33%) | Spouse or Child of Japanese National 14,166 (7%) |
| Myanmar | 182,567 | Specified Skilled Worker 44,523 (24%) | Designated Activities 36,113 (20%) | Student 35,732 (20%) |
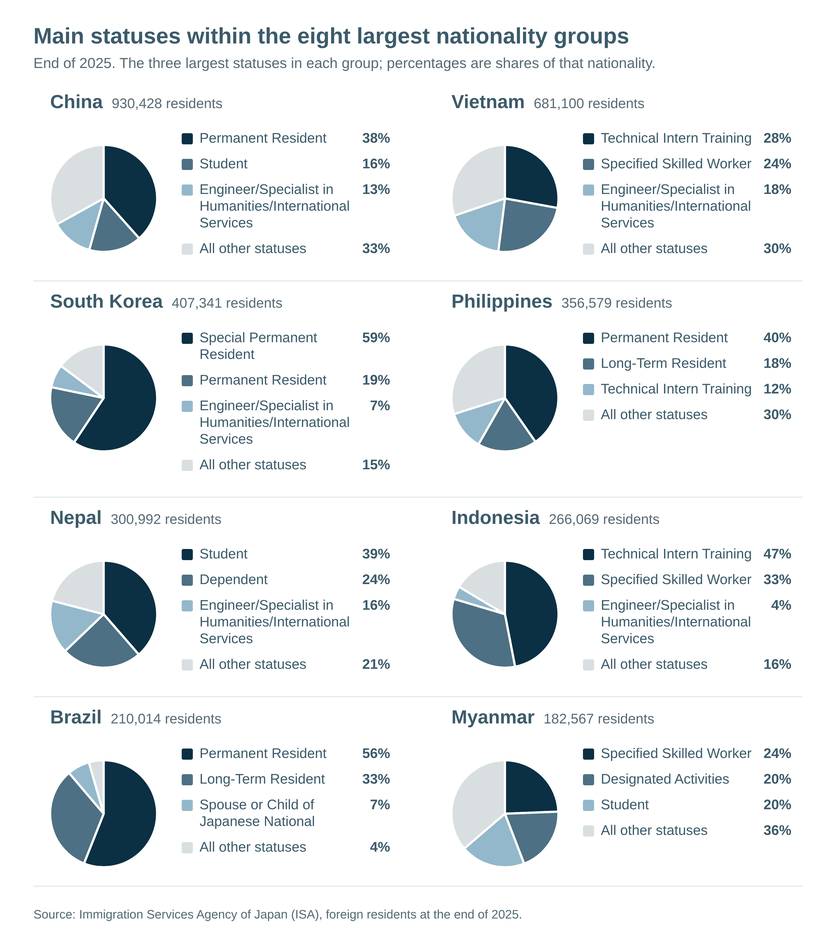
Percentages are shares of each nationality’s total. Special Permanent Resident is counted here as a status, and the ISA’s “other” category is not.
This article is general information based on public ISA documents. It is not legal advice on any individual case.
Source (in Japanese): ISA, “Number of Foreign Residents at the End of 2025” and its attached table (PDF).